So I decided to write one from scratch. This work came from a professional need, and in keeping with the open-source spirit, I’m sharing it with the community.
I created this tempalte a long time ago. At the time, I was literally the first to explore monitoring OracleVM with Zabbix.* 🤓
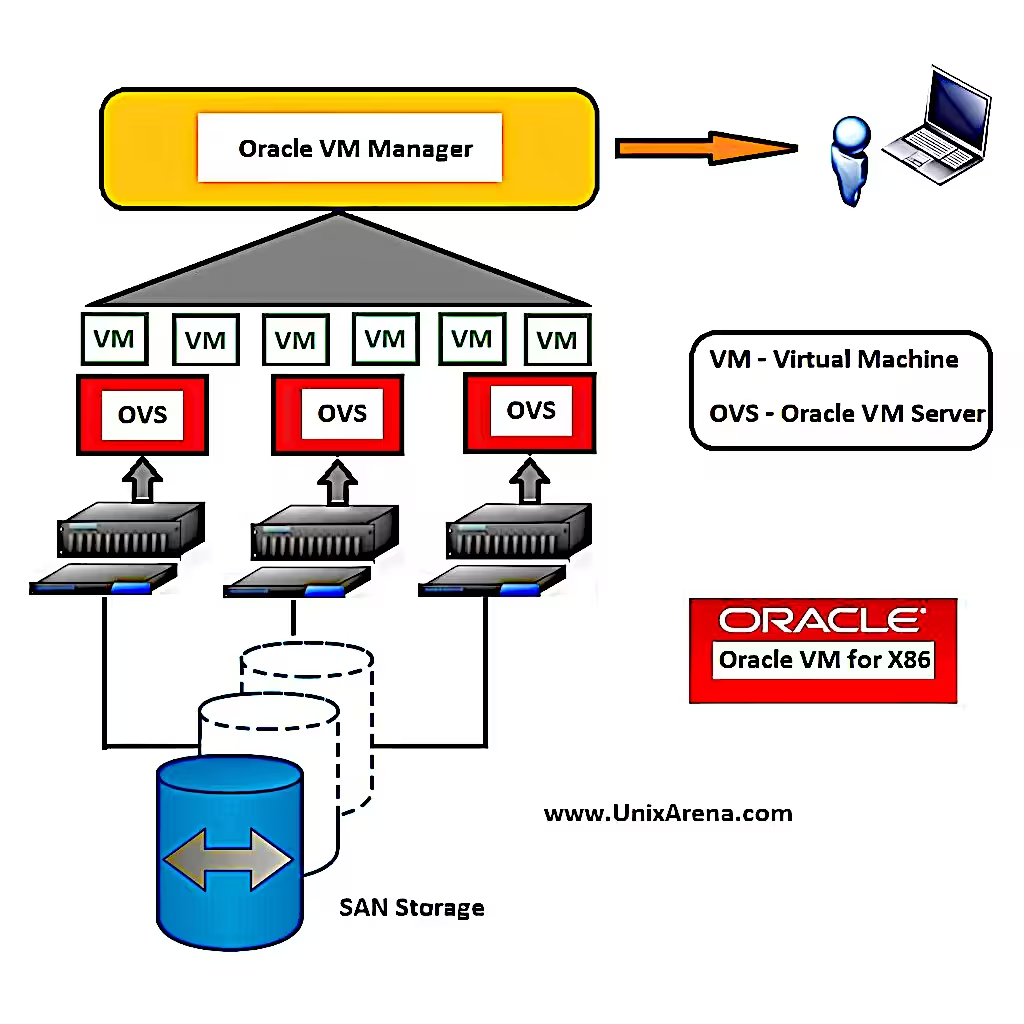
OracleVM is nothing more than a XenCitrix, with some additional work done by Oracle. It is a Hypervisor, used to create and manage Virtual Machines.
Due to the characteristics of the product itself, some data can only be collected by specific means, such as CLI or SNMP. Each form provides different types of data, which is why it was necessary to adopt both. Another important detail is that some items simply cannot be monitored, as OVM does not offer this functionality. At this point, we can only hope that in future upgrades, these gaps will be remedied.
The template is capable of monitoring the following items of an OracleVM Hypervisor:
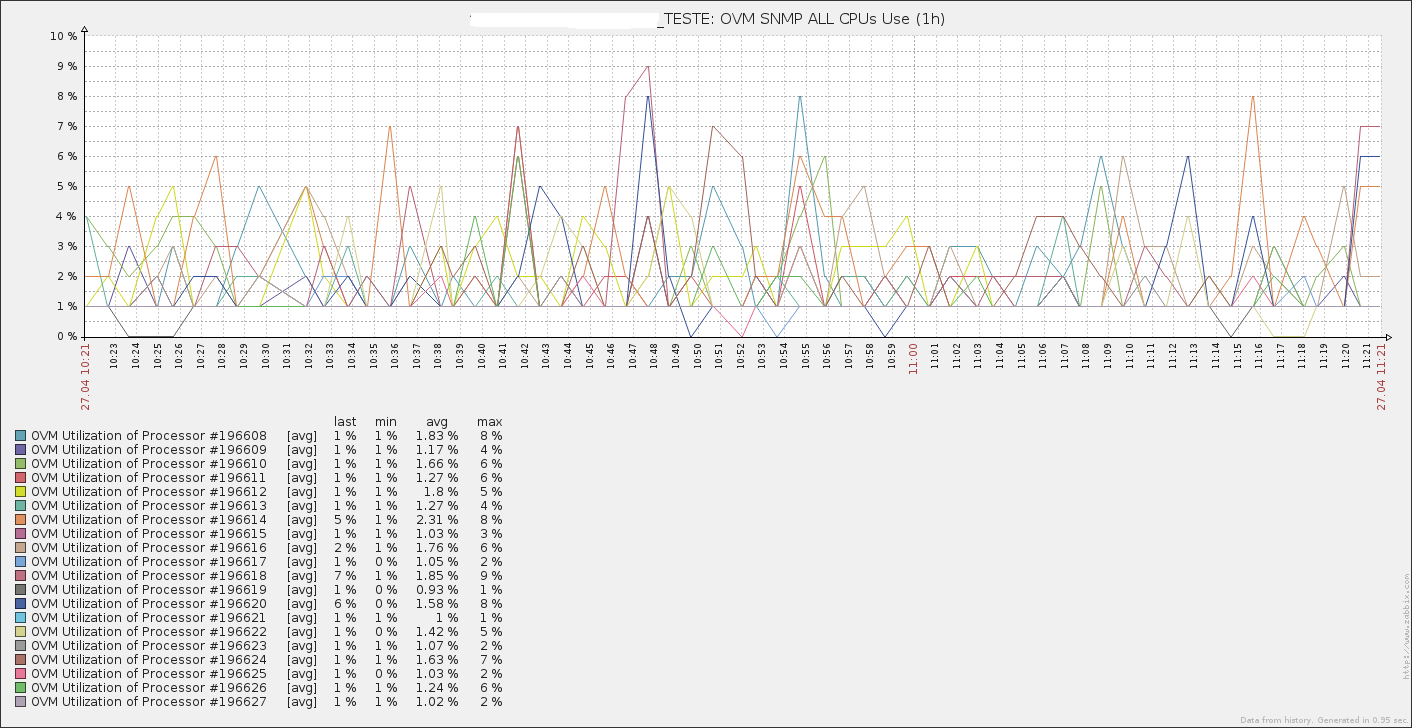
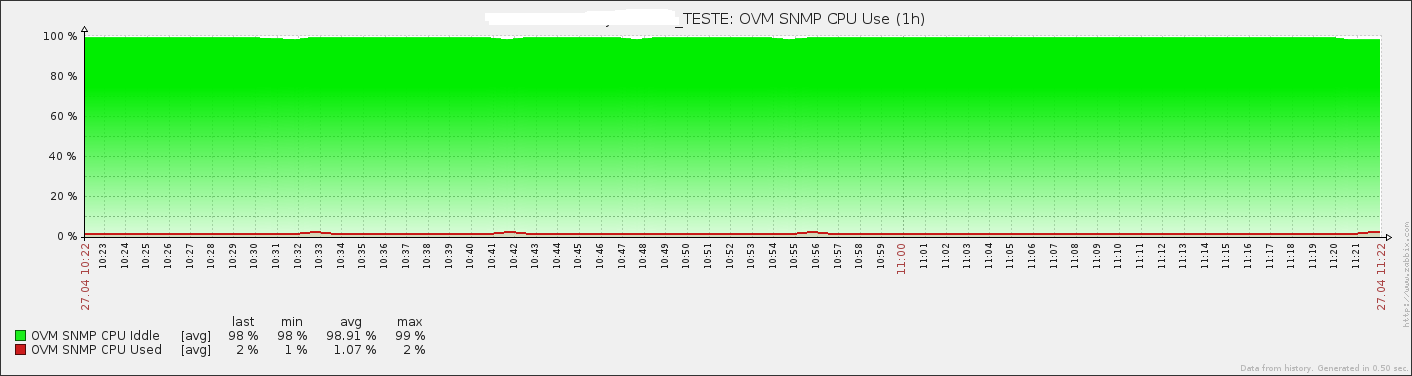
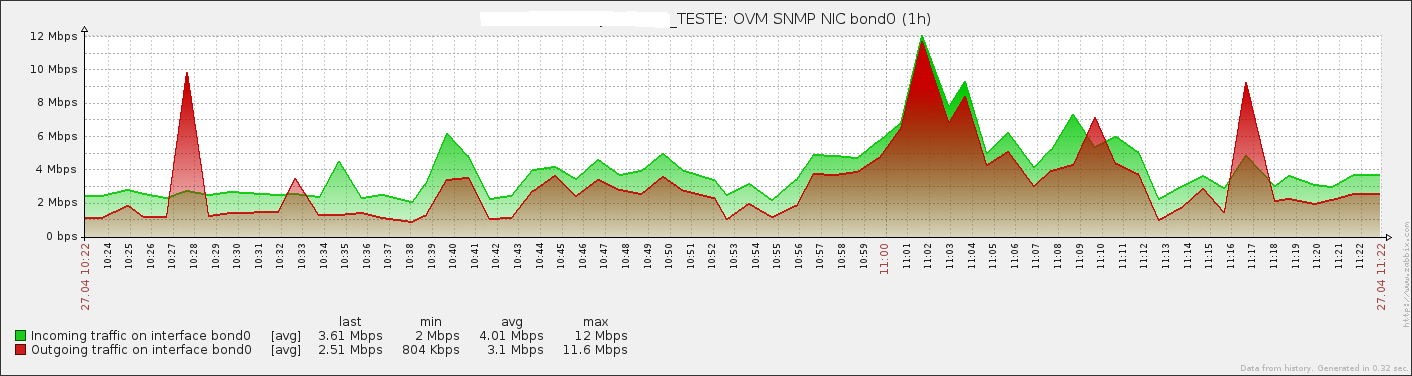
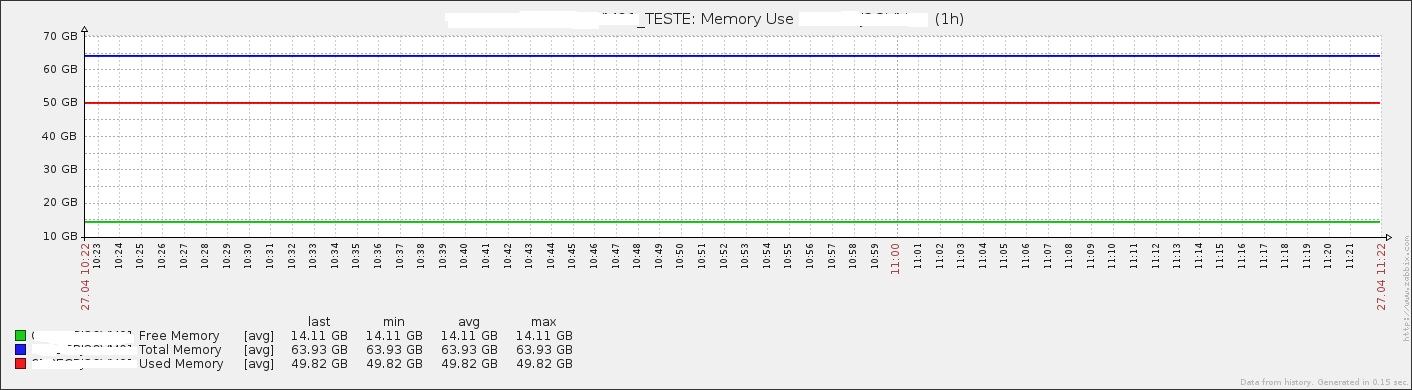
The template is also capable of producing some interesting graphics.
As you may have realized, this post is very old. I only brought it from a snapshot of my old site on waybackmachine, for nostalgia’s sake.
So, although the information here may be useful to you, you’ll probably need to adapt the template and script to work on more modern versions of Zabbix. And of course, you’ll need to take a look at how you currently monitor OracleVM, to see if the way I did things in the past still makes sense.
All the files and other details about the installation and configuration of the template can be found in the snapshot of my Zabbix Share page.
To make things easier, I’ve left a copy available here.
Please support this content by clicking on one of our advertisers’ banners. ❤️